1. The Purpose: Connecting Fragmented Facts into a Single Flow
We live in a world overflowing with information and daily statistics. Yet, amidst complex spreadsheets and endless numbers, finding truly meaningful insights remains difficult. We aim to find the hidden links between scattered raw data worldwide, making massive trends instantly clear to understand.
2. The Approach: The Stunning Difference Intuitive Visualization Makes
Data alone can be dry, but how you present it turns it into the most captivating story. We reject boring reports filled strictly with blocks of text and numbers. Using verified data, we boldly strip away the clutter, reshaping it into visually beautiful and truly Awesome content that anyone can intuitively dive into.
3. The Content: What We Cover and How We Deliver It
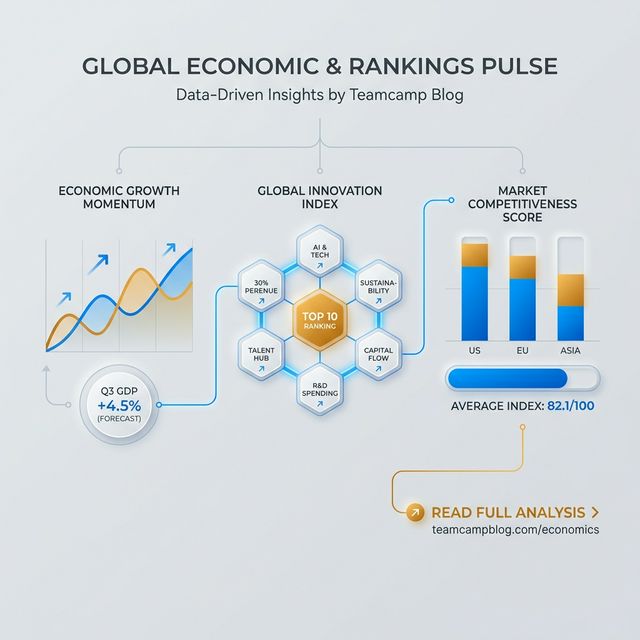
ASUMUP explores global trends across various fields, backed by reliable sources. Our main content includes:
- National Rankings: Comparisons of economic scale, quality of life, and welfare across countries.
- Economy & Business: Global market macro indicators and industry value analyses.
- Sports & Culture: Sports team values, player stats, and socio-cultural phenomenons. Rather than merely listing data, these subjects are masterfully summarized and delivered as clear, definitive ranking charts—the ultimate Sum-up.
4. The Mind Behind ASUMUP: The Curator Weaving the World's Flow
Seeing countless figures and statistics scattered chaotically, I felt a strong desire for someone to organize them into something clear and recognizable. That curiosity and hope birthed this space. The process of independently gathering, refining, and molding data into beautiful rankings is demanding, yet always thrilling. Though it began from my singular perspective, I now invite you to read the world's trends together in the easiest and most enjoyable way possible.